Showing posts with label sneak peek. Show all posts

Monday, December 18, 2023

Security Onion 2.4.40 Sneak Peek!

We recently concluded our 2.4 Feature o' the Day series:


https://blog.securityonion.net/search/label/feature%20o%27%20the%20day


That series did not include every new feature in 2.4 and there are more waiting for you to discover in the current 2.4.30 version. Additionally, there are even more new features coming in future versions!


Security Onion 2.4.40 is coming soon and one of the new features is an updated version of SOC Grid with even more visibility into the health of your deployment. You can click the picture to see a larger version.


Compared to previous versions, there are new fields on the top row that show things like memory, storage, CPU, and network usage. In addition to those new metrics, when you expand the row and look at the Node Status section on the left it now includes additional metrics and visualizations.


You can read more about SOC Grid in our documentation:

https://securityonion.net/docs/grid.html


Hardware Appliances


The screenshot shows what SOC Grid looks like when running on our SOS hardware appliances (notice the appliance pictures on the right). You can learn more about our hardware appliances at:

https://securityonionsolutions.com/hardware


Migrating from 2.3 to 2.4


If you're still running Security Onion 2.3, please note that it reaches End Of Life on April 6, 2024:

https://blog.securityonion.net/2023/10/6-month-eol-notice-for-security-onion-23.html


If you would like to migrate your data from 2.3 to 2.4, you can find an overview of the process at:

https://docs.securityonion.net/en/2.4/appendix.html


Wednesday, May 18, 2022

Sneak Peek: Security Onion 2.3.130 and New Analyzers Feature

We recently released the first sneak peek of our upcoming Security Onion 2.3.130 release and its new Dashboards app. Today, let’s look at another new feature in Security Onion 2.3.130. This release will include analyzers allowing you to quickly gather context around an observable. Analyzers can leverage multiple internal and external sources of data without ever having to leave SOC!


Let’s start by going to the OBSERVABLES tab inside of a case. From the screenshot below, we can see we are working with an observable of type hash and a value of 8a62d103168974fba9c61edab336038c. To start analysis for this observable, we click the lightning bolt icon to the left of the observable creation date. At this point, an analyzer job is enqueued for each analyzer that supports the hash data type and results will be returned once all analyzers have completed their analysis.


Here, we can see results for analysis against a local file, Team Cymru’s Malware Hash Registry, Alienvault OTX, Pulsedive, and VirusTotal. All of these analyzers were initiated automatically since they support the hash observable type.


Each analyzer will have a brief description of the outcome of the analysis, such as No results found, Further investigation needed, or Malicious. We can expand the details for each analyzer to find more information. For example, here are the malwarehashregistry and virustotal sections.


In addition to the hash data type, several other types are supported by analyzers, including domain, ip, url, and more – even ja3!


If the supported data types don’t fit your needs, you can use the localfile analyzer. This will allow you to leverage multiple CSV files if desired, utilizing a data type of other and providing threat intel or other associative information that could contribute to overall context.


In addition to the included analyzers, you can also write your own custom analyzers in Python if you need to leverage other data sources or perform analysis in a different manner.


Security Onion 2.3.130 is coming soon! Until then, here’s what the analyzers feature looks like in action!

Tuesday, May 10, 2022

Sneak Peek: Security Onion 2.3.130 and New Dashboards App

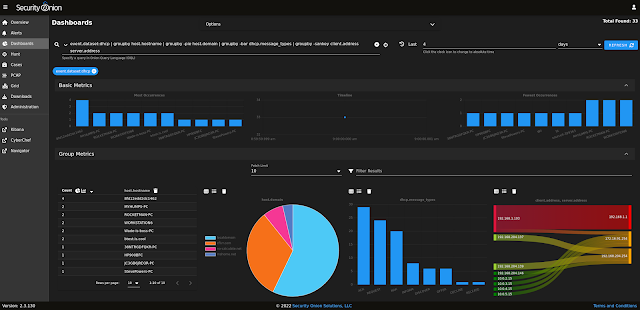
 Security Onion 2.3.130 is coming soon and will include a new Dashboards app!

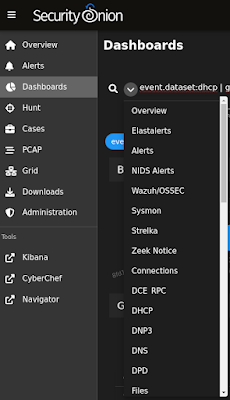
The new Dashboards app will include an entire set of pre-built dashboards for our standard data types.

In addition to the pre-built dashboards, you can make your own dashboards very quickly and easily:

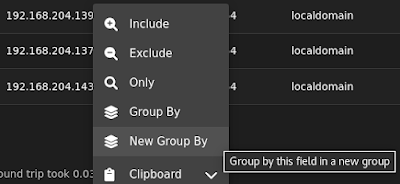
  • create a data table for a particular field using the action menu or by manually typing in a "groupby" option in the query bar

  • add additional fields to that data table OR a new data table
  • convert the data table(s) to a pie chart, bar chart, or sankey diagram using the buttons in the Count column

Here's what it looks like in action!

If you're familiar with our Hunt interface, then you'll feel right at home in Dashboards. The main difference between Hunt and Dashboards is that Dashboards has a different set of default queries that give you one dashboard for each data type, providing a simplified experience. Also, the new capabilities of creating multiple data tables and converting to charts or diagrams carries over to Hunt to make your hunting that much more powerful!

In addition to dashboards, Security Onion 2.3.130 will have another great new feature! Stay tuned for the next sneak peek to learn more!

Search This Blog

Featured Post

Quick Malware Analysis: NETSUPPORT RAT pcap from 2025-08-20

Thanks to Brad Duncan for sharing this pcap from 2025-08-20 on his malware traffic analysis site! Due to issues with Google flagging a warni...

Popular Posts

Blog Archive