Wednesday, November 30, 2011

Security Onion 20111130 now available!


Security Onion 20111130 is now available!  This resolves the following issue:
Issue 144 - sguild.email configuration not loading properly

New Users
New users can download and install the new 20111103 ISO image using the instructions here.  The step marked "Install Security Onion updates" will automatically install this update.

In-place Upgrade
Existing Security Onion users can perform an in-place upgrade using the following command (if you're behind a proxy, remember to set your proxy variables as described in the FAQ):
sudo -i "curl -L http://sourceforge.net/projects/security-onion/files/security-onion-upgrade.sh > ~/security-onion-upgrade.sh && bash ~/security-onion-upgrade.sh"
Note that the upgrade script is cumulative and will upgrade any older version of Security Onion to the most recent version (including any updates in between).

Screenshots
Upgrade Process

Tuesday, November 29, 2011

Notes on Suricata 1.1 Update

A few quick notes on the Suricata 1.1 update and its default suricata.yaml configuration file:

decoder-events.rules and stream-events.rules
By default, suricata.yaml includes the following rules:
 - decoder-events.rules
 - stream-events.rules

This results in alerts like these:
Suricata stream events example
If you don't wish to see these alerts, simply comment out those two rules in /etc/nsm/NAME-OF-SENSOR/suricata.yaml and restart Suricata.

EXTERNAL_NET
By default, suricata.yaml sets EXTERNAL_NET to "!HOME_NET".  (The Snort default in snort.conf is "EXTERNAL_NET any".)  If you'd like to change this, simply make the change in /etc/nsm/NAME-OF-SENSOR/suricata.yaml and restart Suricata.

How do I edit suricata.yaml and restart Suricata?
If you have GUI access to your sensor, you can use the "IDS Config" menu entry as described here:
http://securityonion.blogspot.com/2011/09/security-onion-20110909-now-available.html

Otherwise, you can do the following:

  • Modify /etc/nsm/NAME-OF-SENSOR/suricata.yaml using your favorite text editor.
  • Restart Suricata using the following command:
    sudo nsm --sensor --restart --only-snort-alert

Sunday, November 27, 2011

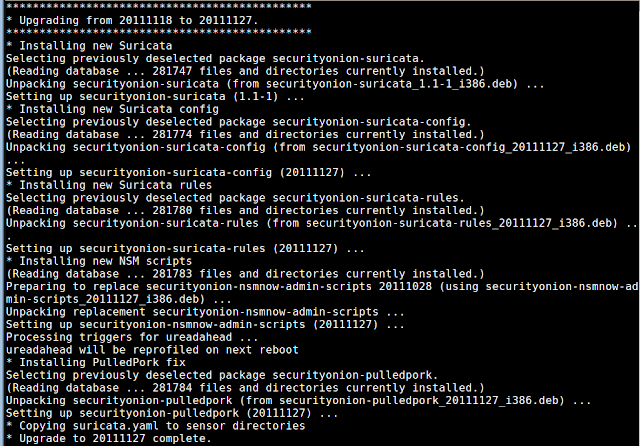
Security Onion 20111127 now available!

Security Onion 20111127 is now available!  This resolves the following issues:
Issue 134 - Upgrade Suricata to 1.1
Issue 153When IDS Engine is Suricata, PulledPork needs to download Suricata version of ET rules

If you are already using Suricata and have customized your suricata.yaml file, please note that it will be backed up to /nsm/backup/20111127/NAME-OF-SENSOR/ and then overwritten with the new config file.  Please copy any of your customizations (HOME_NET, etc.) from /nsm/backup/20111127/NAME-OF-SENSOR/suricata.yaml to the production copy /etc/nsm/NAME-OF-SENSOR/suricata.yaml.

New Users
New users can download and install the 20111103 ISO image using the instructions here.  The step marked "Install Security Onion updates" will automatically install this update.

In-place Upgrade
Existing Security Onion users can perform an in-place upgrade using the following command (if you're behind a proxy, remember to set your proxy variables as described in the FAQ):
sudo -i "curl -L http://sourceforge.net/projects/security-onion/files/security-onion-upgrade.sh > ~/security-onion-upgrade.sh && bash ~/security-onion-upgrade.sh"
Note that the upgrade script is cumulative and will upgrade any older version of Security Onion to the most recent version (including any updates in between).

Switching to Suricata
If you're currently running Snort and would like to switch to Suricata, use the following commands to stop Snort, change the ENGINE variable in the config file, and then run PulledPork to download the Suricata-specific ruleset (if running Emerging Threats rules):
sudo nsm_sensor_ps-stop --only-snort-alert
sudo sed -i 's|ENGINE=snort|ENGINE=suricata|g' /etc/nsm/securityonion.conf
sudo /usr/local/bin/pulledpork_update.sh 
Screenshots
Upgrade Process

Thursday, November 17, 2011

Follow-up on OSSEC alerts for packet loss


This is a follow-up to my recent post "How do I receive an email when my sensor stops receiving traffic?".  That post explains the core idea which I have since refined.


Refinement #1: Tell me which interface stopped receiving traffic
The first area of refinement is making the output a little more verbose so that, if we have multiple interfaces, we know exactly which interface stopped receiving traffic.  We do that by modifying the "bandwidth" command in /var/ossec/etc/ossec.conf as follows:
  <localfile>
    <log_format>command</log_format>
    <command>grep -v "^#" /etc/nsm/sensortab |awk '{print $1}' |while read SENSOR; do INTERFACE=`echo $SENSOR|cut -d\- -f3`; echo -n "$INTERFACE: "; tail -1 /nsm/sensor_data/$SENSOR/snort.st
ats |cut -d\, -f3; done</command>
    <alias>bandwidth</alias>
  </localfile>
Refinement #2: Give me more flexibility in the OSSEC rule structure
The second area of refinement is implementing a tiered OSSEC rule structure.  This gives us more flexibility and troubleshooting capability.  We do this by editing /var/ossec/rules/local_rules.xml and replacing our previous single rule with these two rules:

 <rule id="100001" level="1">
    <if_sid>530</if_sid>
    <match>ossec: output: 'bandwidth':</match>
    <description>Bandwidth statistics from snort.stats</description>
  </rule>
  <rule id="100002" level="7">
    <if_sid>100001</if_sid>
    <regex>0.000</regex>
    <description>Bandwidth down to 0.000.  Please check interface, cabling, and tap/span!</description>
  </rule>
The first rule just identifies "bandwidth" output and only logs it to disk (level 1 alerts do not generate email by default).  The second rule is a child rule of the first and alerts/emails (level 7) when bandwidth is down to 0.000. 

Since we're now logging all "bandwidth" output, we can search for it in the OSSEC logs:
grep "bandwidth" /var/ossec/logs/alerts/alerts.log
2011 Nov 17 14:28:50 so->bandwidth
ossec: output: 'bandwidth': eth4: 8.940
2011 Nov 17 14:28:50 so->bandwidth
ossec: output: 'bandwidth': eth5: 7.189
2011 Nov 17 14:38:54 so->bandwidth
ossec: output: 'bandwidth': eth4: 8.920
2011 Nov 17 14:38:54 so->bandwidth
ossec: output: 'bandwidth': eth5: 7.223
Refinement #3: Use Linux kernel's built-in packet counters instead of relying on snort.stats
The third area of refinement is not relying on snort.stats but instead using the Linux kernel's built-in packet counters.  (I hinted at this in the previous post.)  This could be used to replace the entire "bandwidth" configuration above, or to complement it for a belt-and-suspenders approach.  We start off by adding the following to /var/ossec/etc/ossec.conf:

  <localfile>
    <log_format>command</log_format>
    <command>grep -v "^#" /etc/nsm/sensortab |awk '{print $4}' |while read SENSOR; do echo -n "$SENSOR: "; RX1=`ifconfig $SENSOR |awk '/RX packets/ {print $2}' |cut -d\: -f2`; sleep 300; RX2
=`ifconfig $SENSOR |awk '/RX packets/ {print $2}' |cut -d\: -f2`; expr $RX2 - $RX1; done</command>
    <alias>packets_received</alias>
  </localfile>
This follows the same format as the "bandwidth" command, but pulls the count of received packets from ifconfig, waits 5 minutes, pulls the RX count from ifconfig a second time, and subtracts the first from the second to get the total number of packets received in the 5-minute interval.

Next, we add these two rules to /var/ossec/rules/local_rules.xml:
  <rule id="100003" level="1">
    <if_sid>530</if_sid>
    <match>ossec: output: 'packets_received':</match>
    <description>Number of packets received in 5-minute interval</description>
  </rule>
<rule id="100004" level="7">
    <if_sid>100003</if_sid>
    <regex> 0</regex>
    <description>Received 0 packets in a 5-minute interval.  Please check interface, cabling, and tap/span!</description>
  </rule>
Since we're now logging all "packets_received" output, we can search for it in the OSSEC logs:
grep "packets_received" /var/ossec/logs/alerts/alerts.log
2011 Nov 17 14:33:50 so->packets_received
ossec: output: 'packets_received': eth4: 70969
2011 Nov 17 14:38:50 so->packets_received
ossec: output: 'packets_received': eth5: 63059
2011 Nov 17 14:43:54 so->packets_received
ossec: output: 'packets_received': eth4: 71030
2011 Nov 17 14:48:54 so->packets_received
ossec: output: 'packets_received': eth5: 67475
When the number of received packets drops to 0, rule 100004 triggers a level 7 alert, generating an email if configured to do so.

Security Onion 20111118 now available!


Security Onion 20111118 is now available!  This resolves the following issue:
Issue 141 - Upgrade Barnyard2

New Users
New users can download and install the new 20111103 ISO image using the instructions here and then follow the In-Place Upgrade instructions below.

In-place Upgrade
Existing Security Onion users can perform an in-place upgrade using the following command (if you're behind a proxy, remember to set your proxy variables as described in the FAQ):
sudo -i "curl -L http://sourceforge.net/projects/security-onion/files/security-onion-upgrade.sh > ~/security-onion-upgrade.sh && bash ~/security-onion-upgrade.sh"
Note that the upgrade script is cumulative and will upgrade any older version of Security Onion to the most recent version (including any updates in between).

Screenshots
Upgrade Process

Wednesday, November 16, 2011

Security Onion 20111116 now available!


Security Onion 20111116 is now available!  This resolves the following issue:
Issue 150 - Ensure that OSSEC timezone matches the host's timezone

New Users
New users can download and install the new 20111103 ISO image using the instructions here and then follow the In-Place Upgrade instructions below.

In-place Upgrade
Existing Security Onion users can perform an in-place upgrade using the following command (if you're behind a proxy, remember to set your proxy variables as described in the FAQ):
sudo -i "curl -L http://sourceforge.net/projects/security-onion/files/security-onion-upgrade.sh > ~/security-onion-upgrade.sh && bash ~/security-onion-upgrade.sh"
Note that the upgrade script is cumulative and will upgrade any older version of Security Onion to the most recent version (including any updates in between).

Screenshots
Upgrade Process

Tuesday, November 15, 2011

How do I receive an email when my sensor stops receiving traffic?

Recently, I logged into Sguil and noticed that a normally busy sensor had no current alerts.  I looked at the full packet capture logs for the sensor and determined that it hadn't received any traffic from the tap in a while.  We resolved the issue with the tap and started seeing traffic again, but I also resolved to create an automated notification for the next time this happens.

Snort is already writing bandwidth statistics to /nsm/sensor_data/$SENSOR/snort.stats and we are going to use OSSEC to monitor the file and send email when the bandwidth drops to 0.  We could possibly write an OSSEC decoder to have it parse snort.stats directly, but let's instead use OSSEC's process monitoring feature so that we can perhaps extend this in the future to use the Linux kernel's built-in packet counters.  For now, we're going to rely on snort.stats.

The first thing we need to do is obtain the full path to the snort.stats file(s) by determining the interfaces that are being monitored by Sguil.  We do this by searching /etc/nsm/sensortab for any lines that are not commented out and piping to awk to print just the first column:
grep -v "^#" /etc/nsm/sensortab |awk '{print $1}'
For each of the sensors in the output of the previous command, we want to look at the most recent bandwidth statistics, so we pipe to a while-loop and use "tail -1" on the respective snort.stats file:
grep -v "^#" /etc/nsm/sensortab |awk '{print $1}' |while read SENSOR; do tail -1 /nsm/sensor_data/$SENSOR/snort.stats; done
snort.stats is a CSV file and we only want the third column of data, so we pipe the previous command to cut and tell it the delimiter is a comma and to output the third field:
grep -v "^#" /etc/nsm/sensortab |awk '{print $1}' |while read SENSOR; do tail -1 /nsm/sensor_data/$SENSOR/snort.stats; done |cut -d\, -f3
Here's some sample output for a sensor with two monitored interfaces:
3.481
0.089
We now have a nice single command that OSSEC can run periodically to retrieve the bandwidth of our monitored interfaces.  We add this as a "command" in /var/ossec/etc/ossec.conf and give it an alias of "bandwidth":
  <localfile>
    <log_format>command</log_format>
    <command>grep -v "^#" /etc/nsm/sensortab |awk '{print $1}' |while read SENSOR; do tail -1 /nsm/sensor_data/$SENSOR/snort.stats; done |cut -d\, -f3</command>
    <alias>bandwidth</alias>
  </localfile>
Upon restart, OSSEC will periodically run the command, but won't do anything with the output until we add a rule to tell it what to do.  We add the following rule to /var/ossec/rules/local_rules.xml to check the output hourly (every 3600 seconds) and see if the bandwidth value has gone down to 0.000:
  <rule id="100001" level="7" ignore="3600">
    <if_sid>530</if_sid>
    <match>ossec: output: 'bandwidth':</match>
    <regex>0.000</regex>
    <description>Bandwidth down to 0.000.  Please check interface, cabling, and tap/span!</description>
  </rule>
If we didn't already have OSSEC configured to send email, we could do so by adding the following to the <global> section of /var/ossec/etc/ossec.conf:
    <email_notification>yes</email_notification>
    <email_to>YOUR.USERNAME@YOUR-DOMAIN.COM</email_to>
    <smtp_server>YOUR-SMTP-RELAY.YOUR-DOMAIN.COM</smtp_server>
    <email_from>OSSEC@YOUR-DOMAIN.COM</email_from>
Next, we restart OSSEC to activate the new configuration:
sudo service ossec restart
Finally, we simulate traffic loss and receive an email like the following:
OSSEC HIDS Notification.
2011 Nov 15 06:47:45
Received From: securityonion->bandwidth
Rule: 100001 fired (level 7) -> "Bandwidth down to 0.000.  Please check interface, cabling, and tap/span!"
Portion of the log(s):
ossec: output: 'bandwidth': 0.000
UpdateA question over on Google+ prompted the following clarification:
Security Onion has Snort's perfmonitor configured for 300-second intervals by default, which means that the value we're inspecting would be the average traffic for 5 minutes. My deployments have enough constant traffic that 0.000 for 5 minutes is a pretty good indicator of failure. YMMV! 

Thursday, November 3, 2011

Security Onion 20111103 now available!


Security Onion 20111103 is now available!  This resolves the following issues:
Issue 138 - Time for a new ISO image
Issue 136 - Setup script should automatically set OS timezone to UTC
Issue 137 - Bro 2.0 Beta

Please note that Bro 2.0 Beta installs to /usr/local/bro/.

For more information about Bro 2.0 Beta, please see:

New Users
New users can download and install the new 20111103 ISO image using the instructions here.

In-place Upgrade
Existing Security Onion users can perform an in-place upgrade using the following command (if you're behind a proxy, remember to set your proxy variables as described in the FAQ):
sudo -i "curl -L http://sourceforge.net/projects/security-onion/files/security-onion-upgrade.sh > ~/security-onion-upgrade.sh && bash ~/security-onion-upgrade.sh"
Note that the upgrade script is cumulative and will upgrade any older version of Security Onion to the most recent version (including any updates in between).

Screenshots

Upgrade Process

Completing Upgrade

Bro 2.0 Beta in /usr/local/bro/bin/bro


Search This Blog

Featured Post

Coming soon to Security Onion: Elastic Agent Deployment via MSI!

Our upcoming Security Onion 2.4.120 release includes a new MSI option for deploying the Elastic Agent to your Windows endpoints!  Security O...

Popular Posts

Blog Archive